01/ THE CHALLENGE
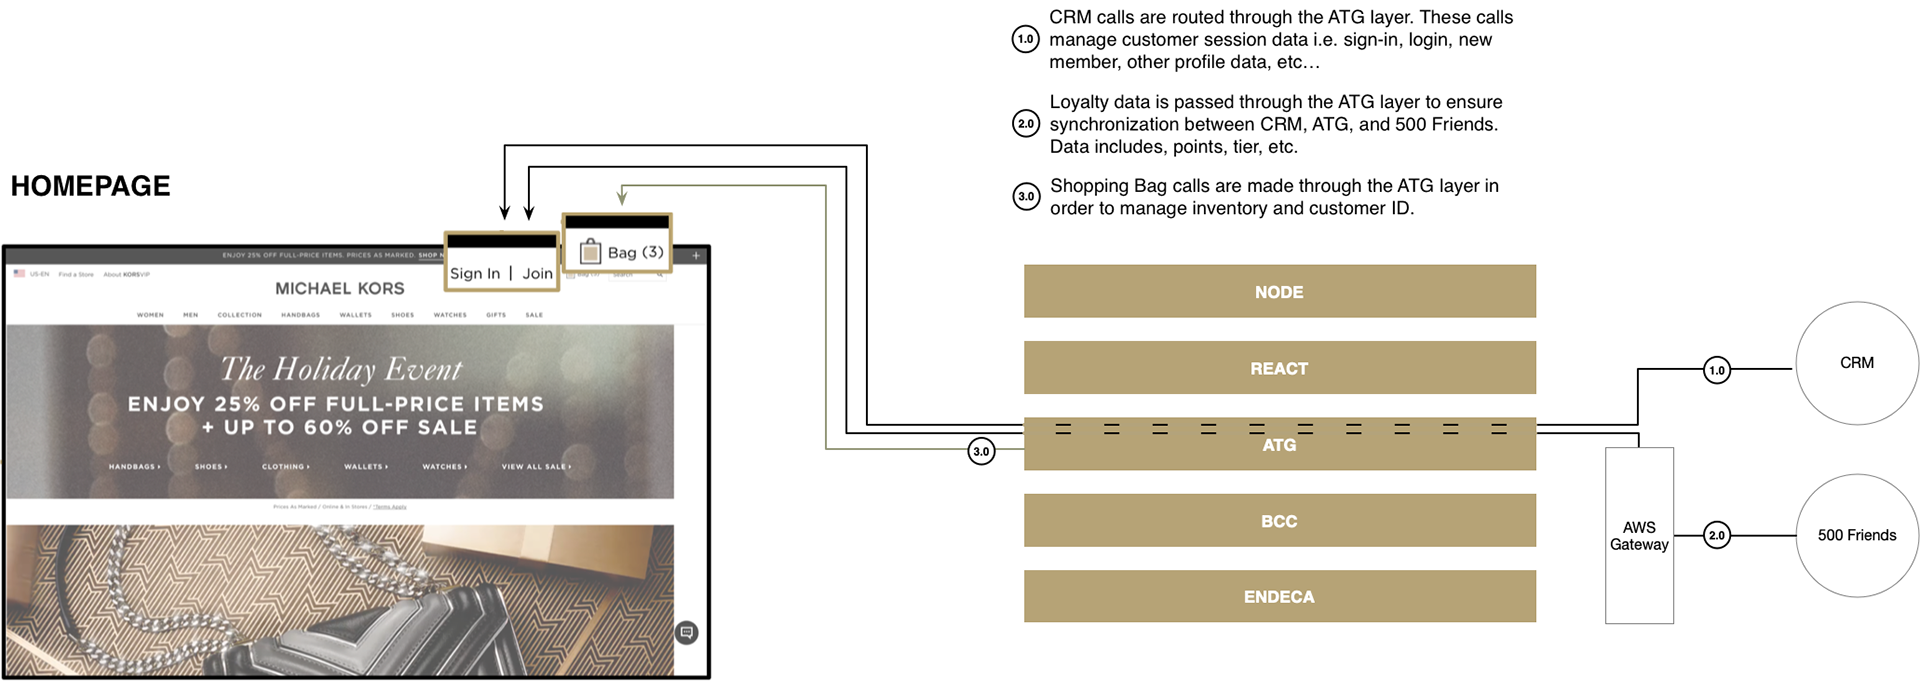
VISUALLY COMMUNICATE THE DATA JOURNEY AND INTEGRATION TOUCH POINTS
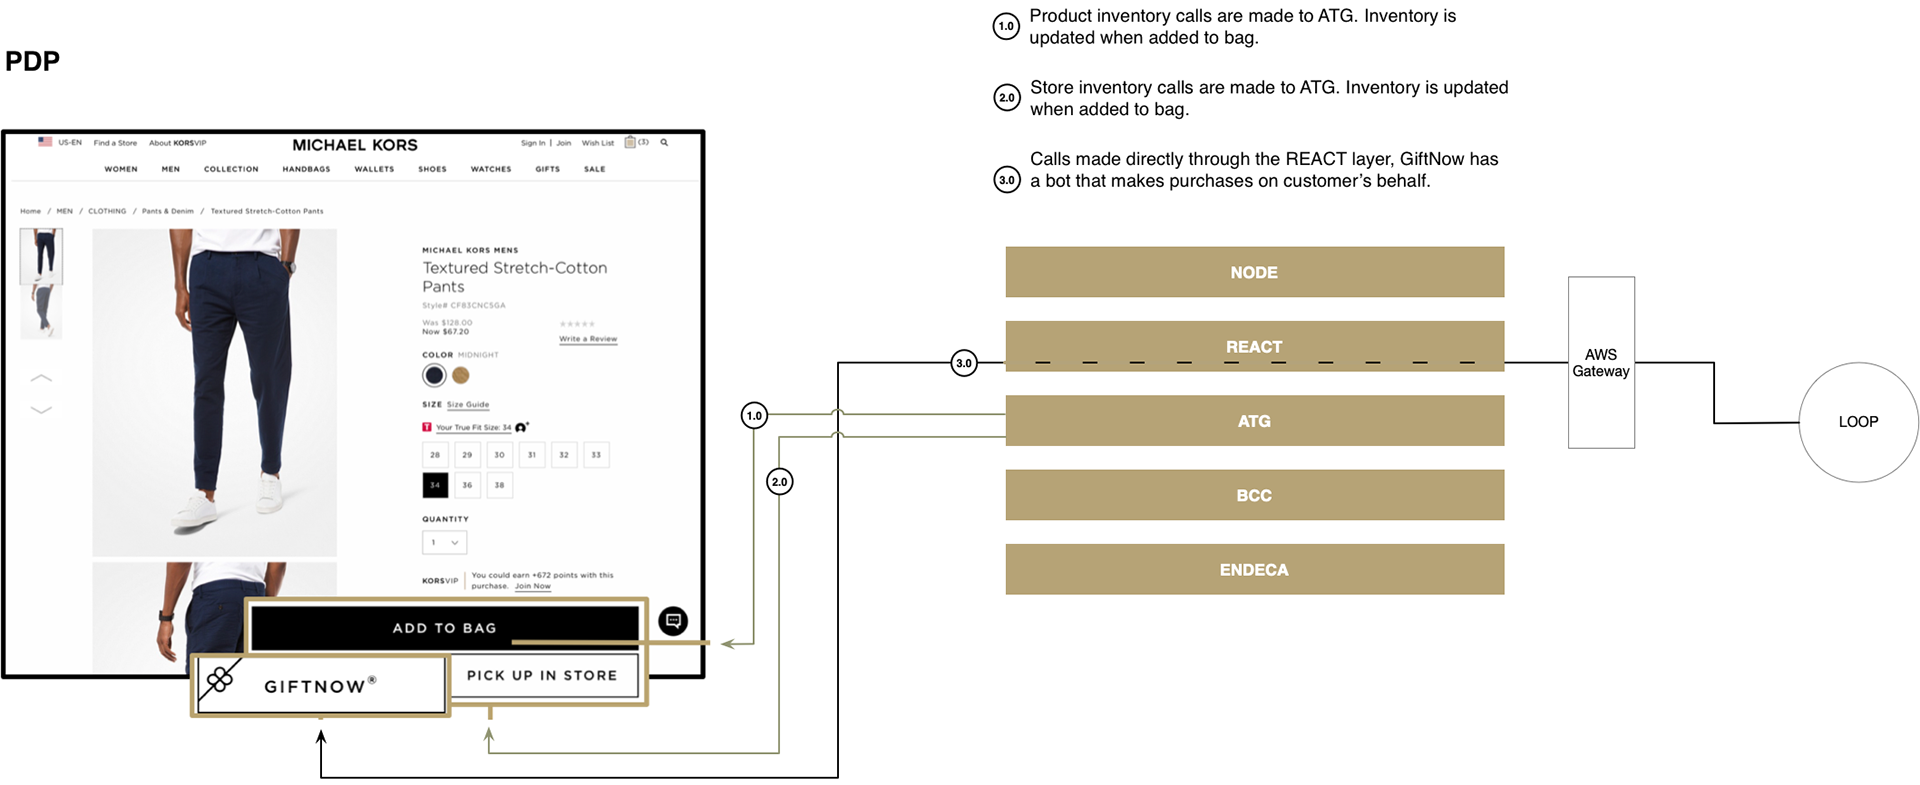
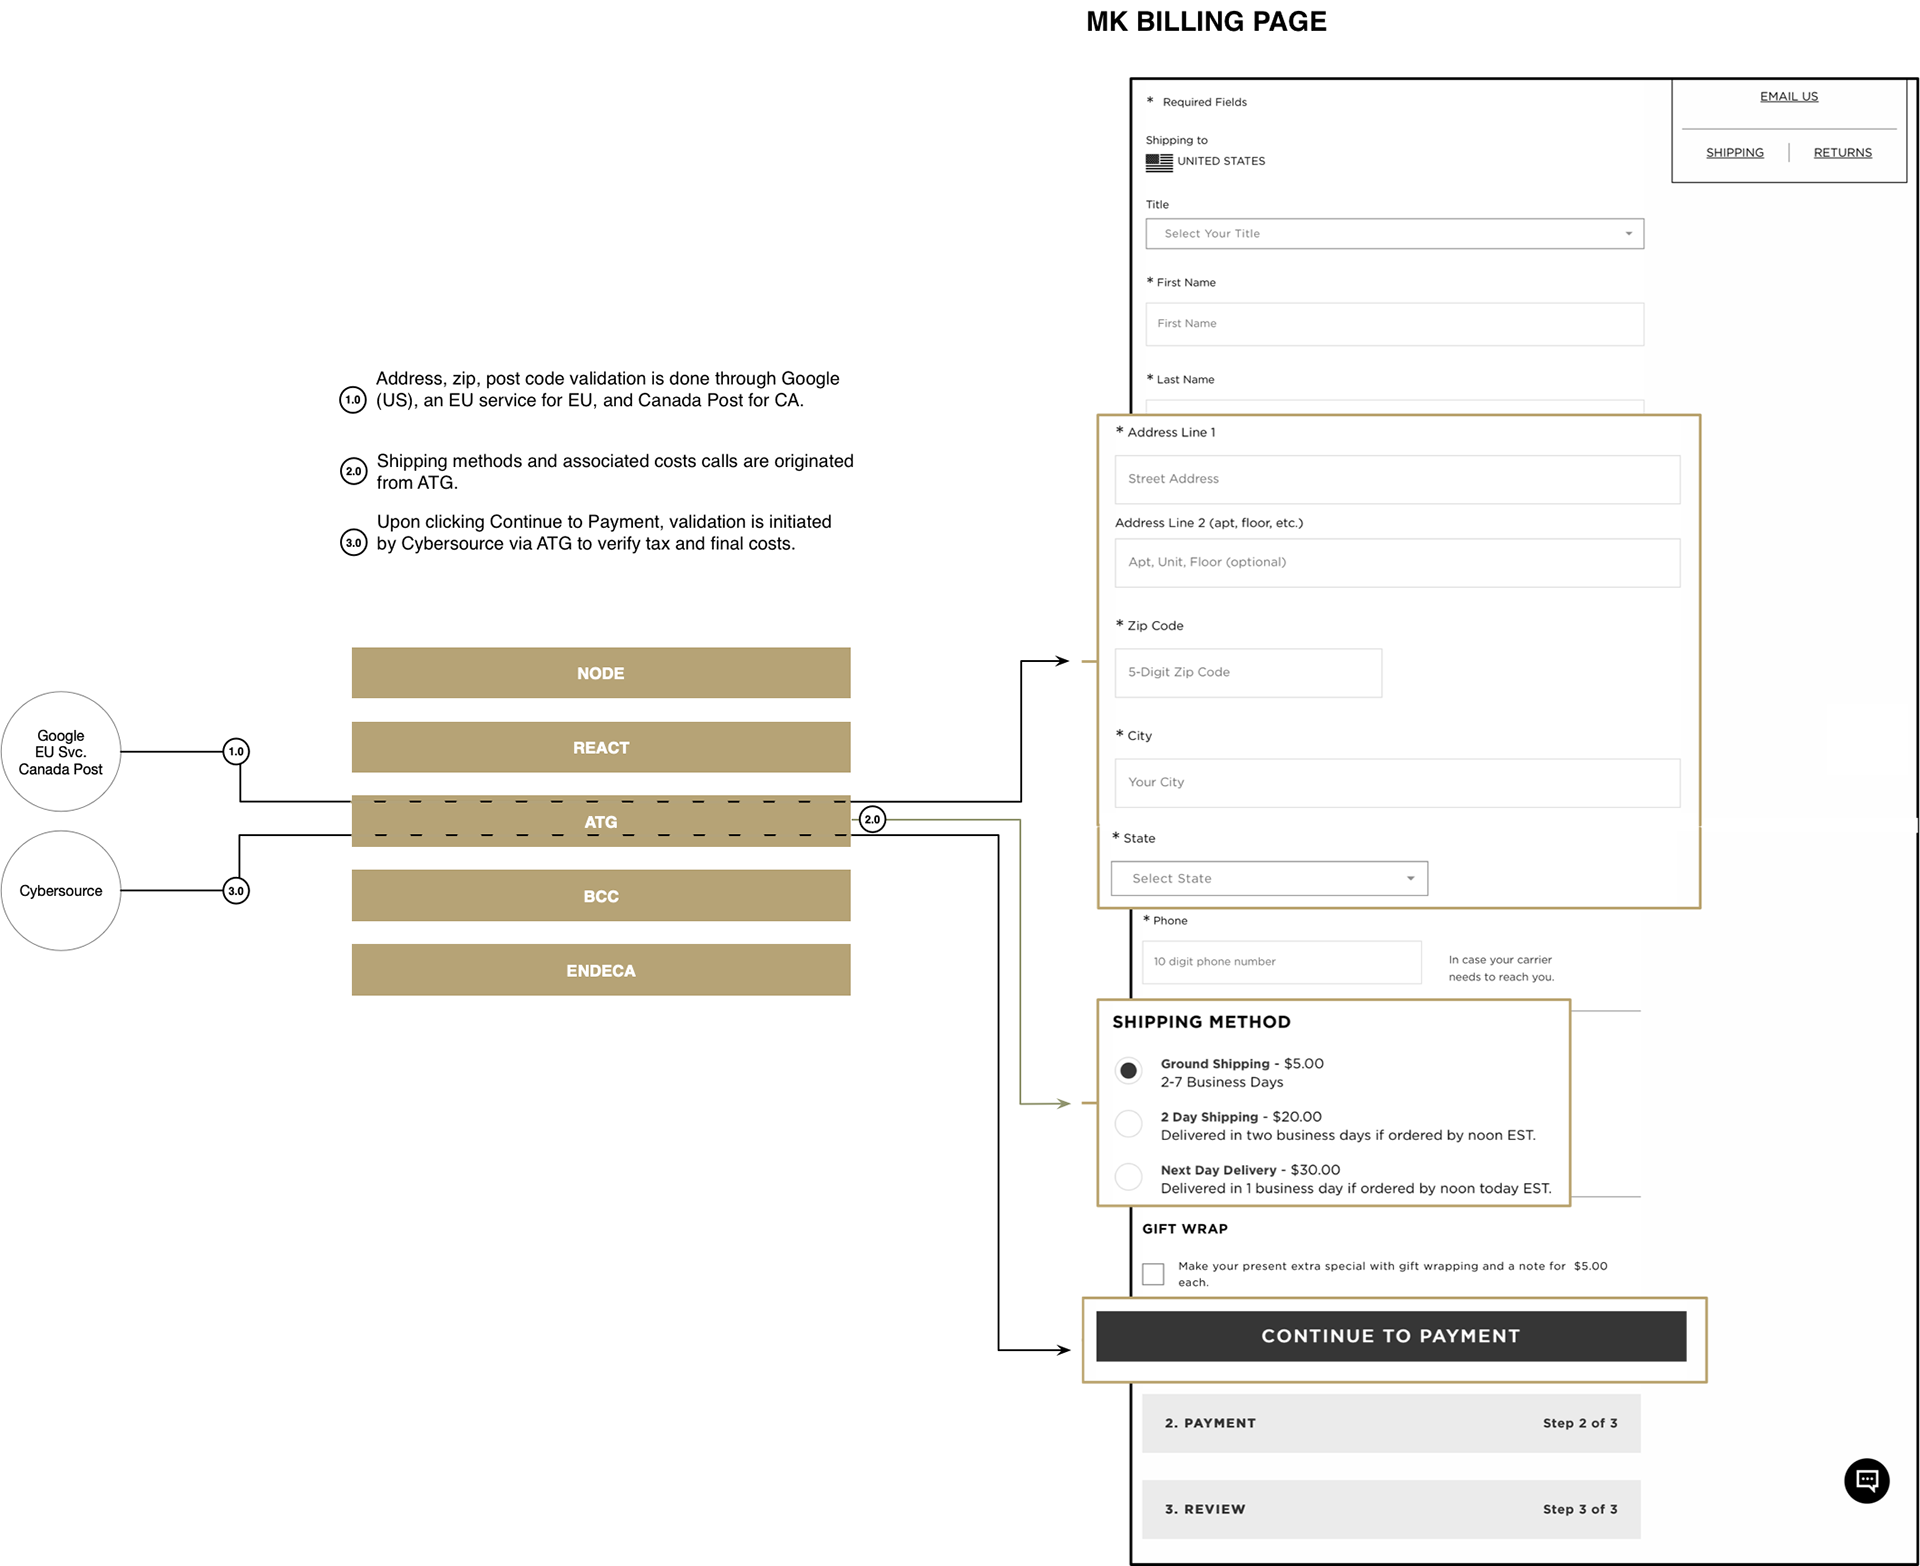
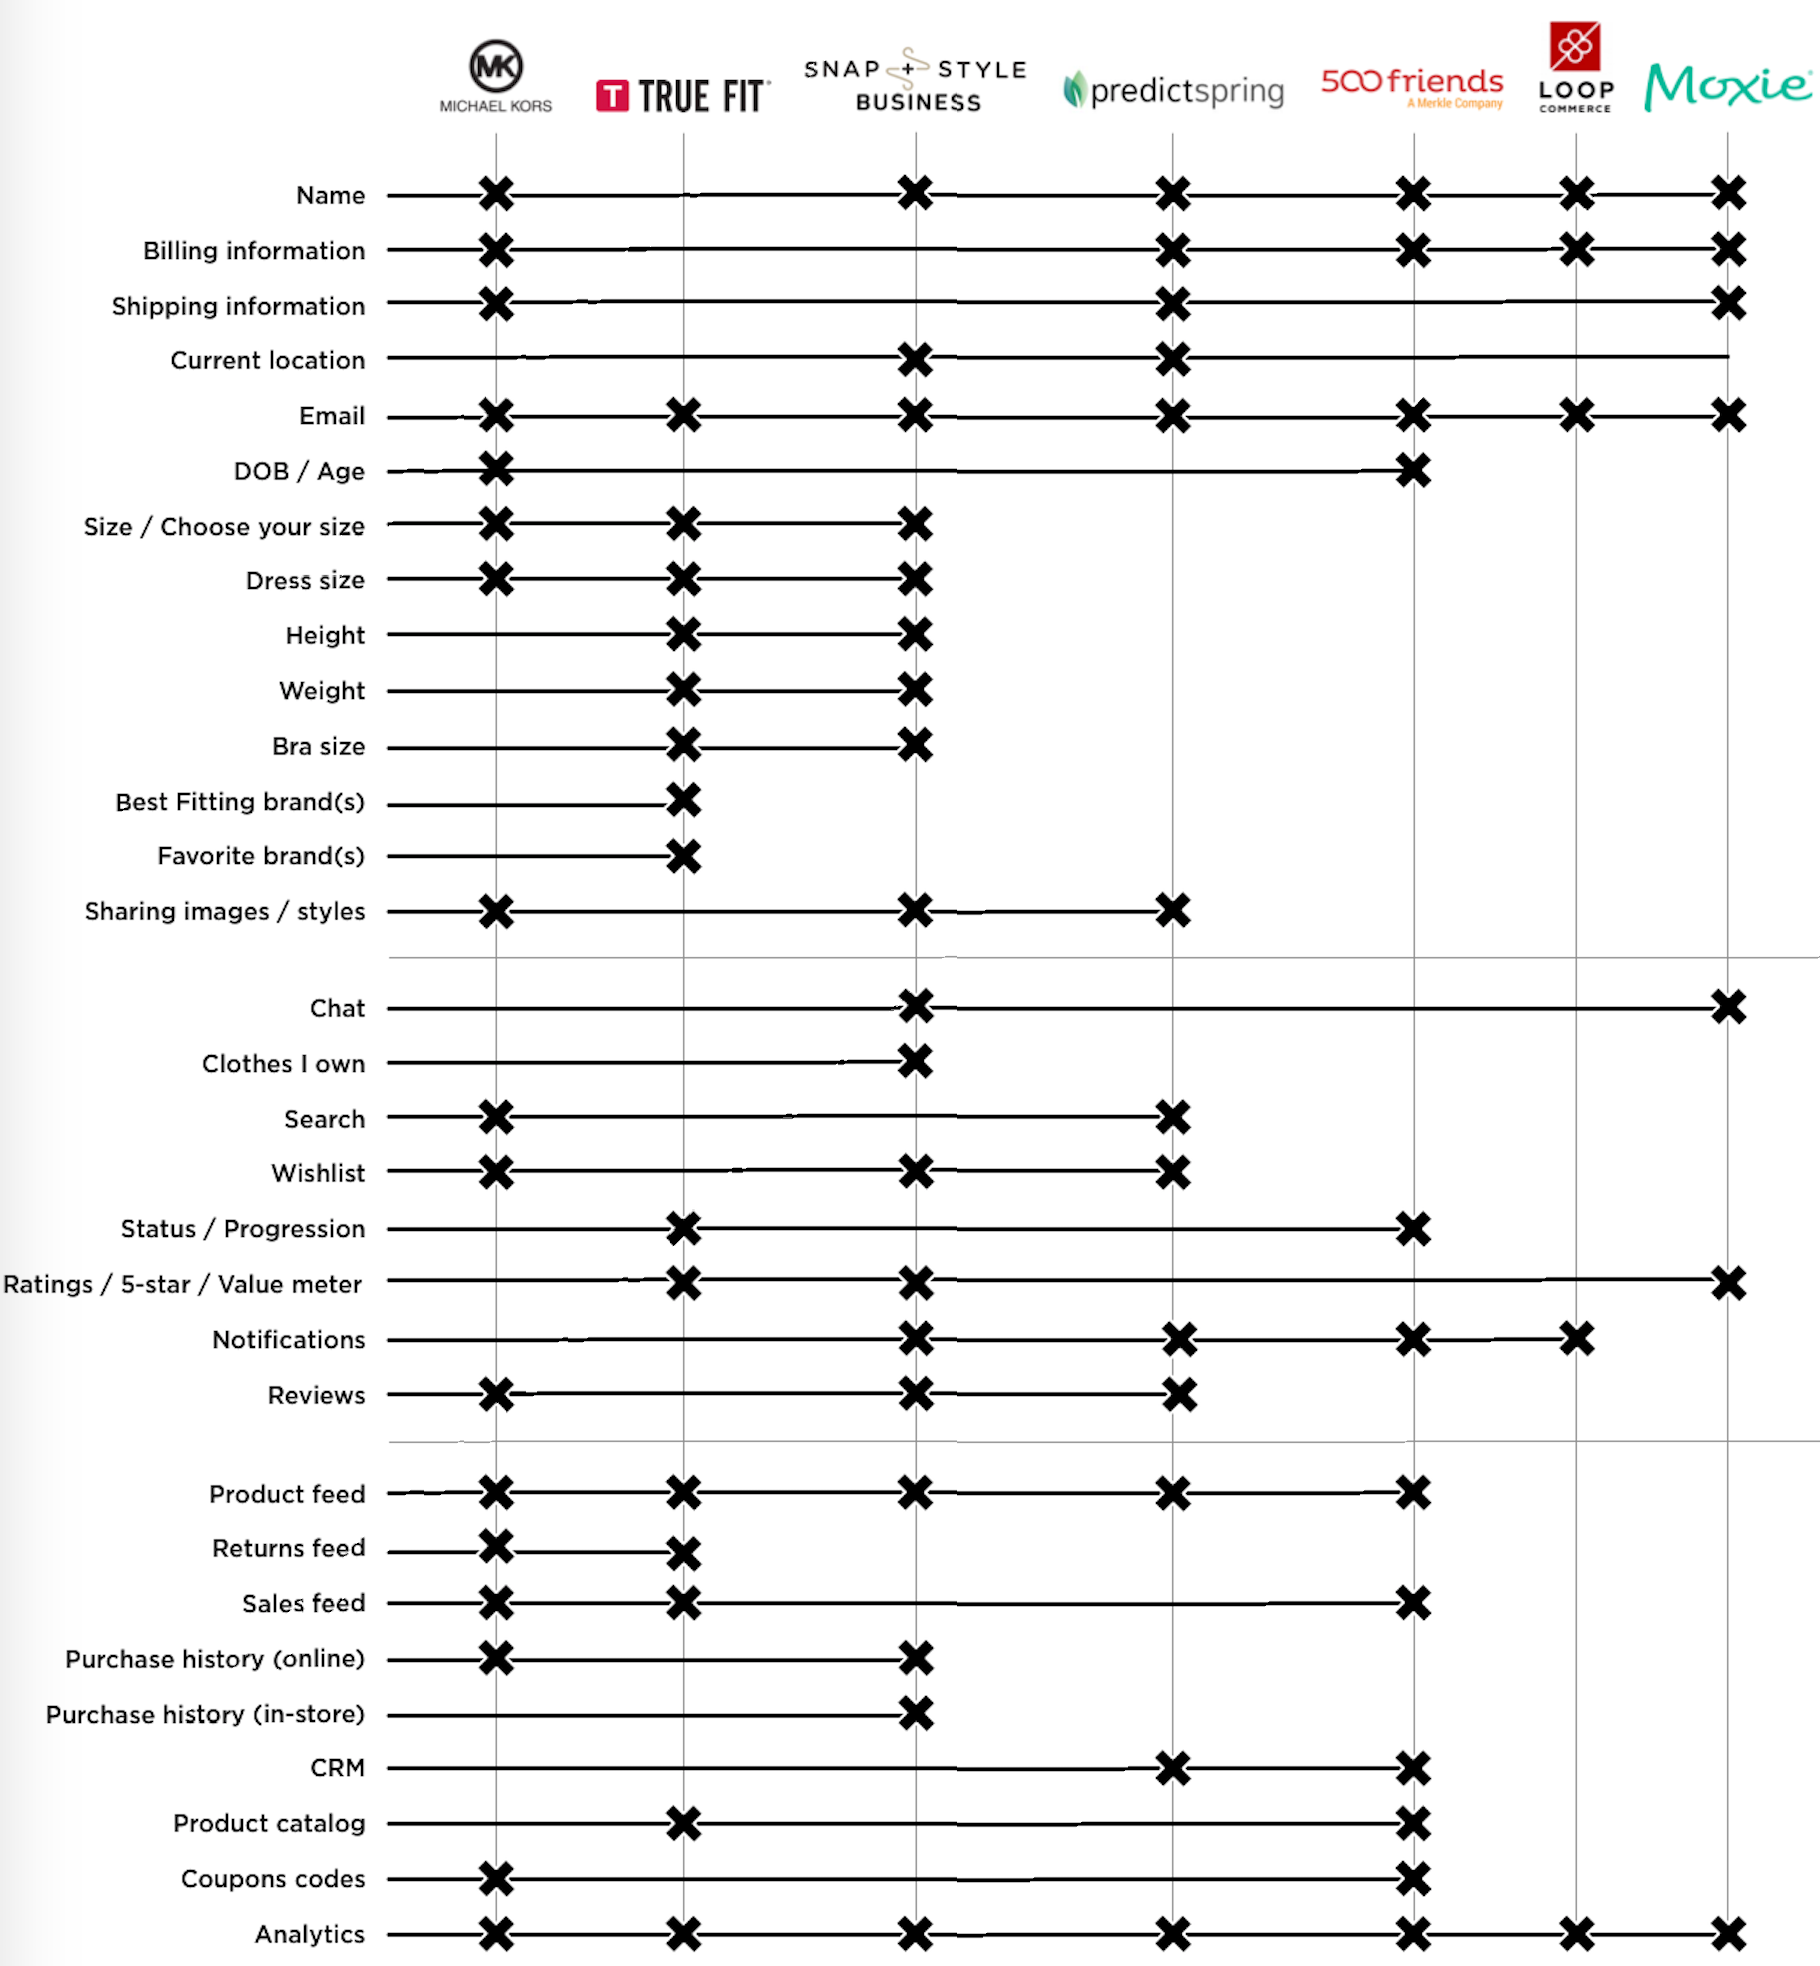
Customer journeys not only have interaction touch points but they also have data touch points. The problem that I surmised from executive-level leadership was:
1) Minimize friction communicating and understanding how system APIs integrate internally and with 3rd party solutions.
2) Communicate the moments at which data was routed and "permissioned" through the AWS Gateway or directly into ATG.
02/ THE APPROACH
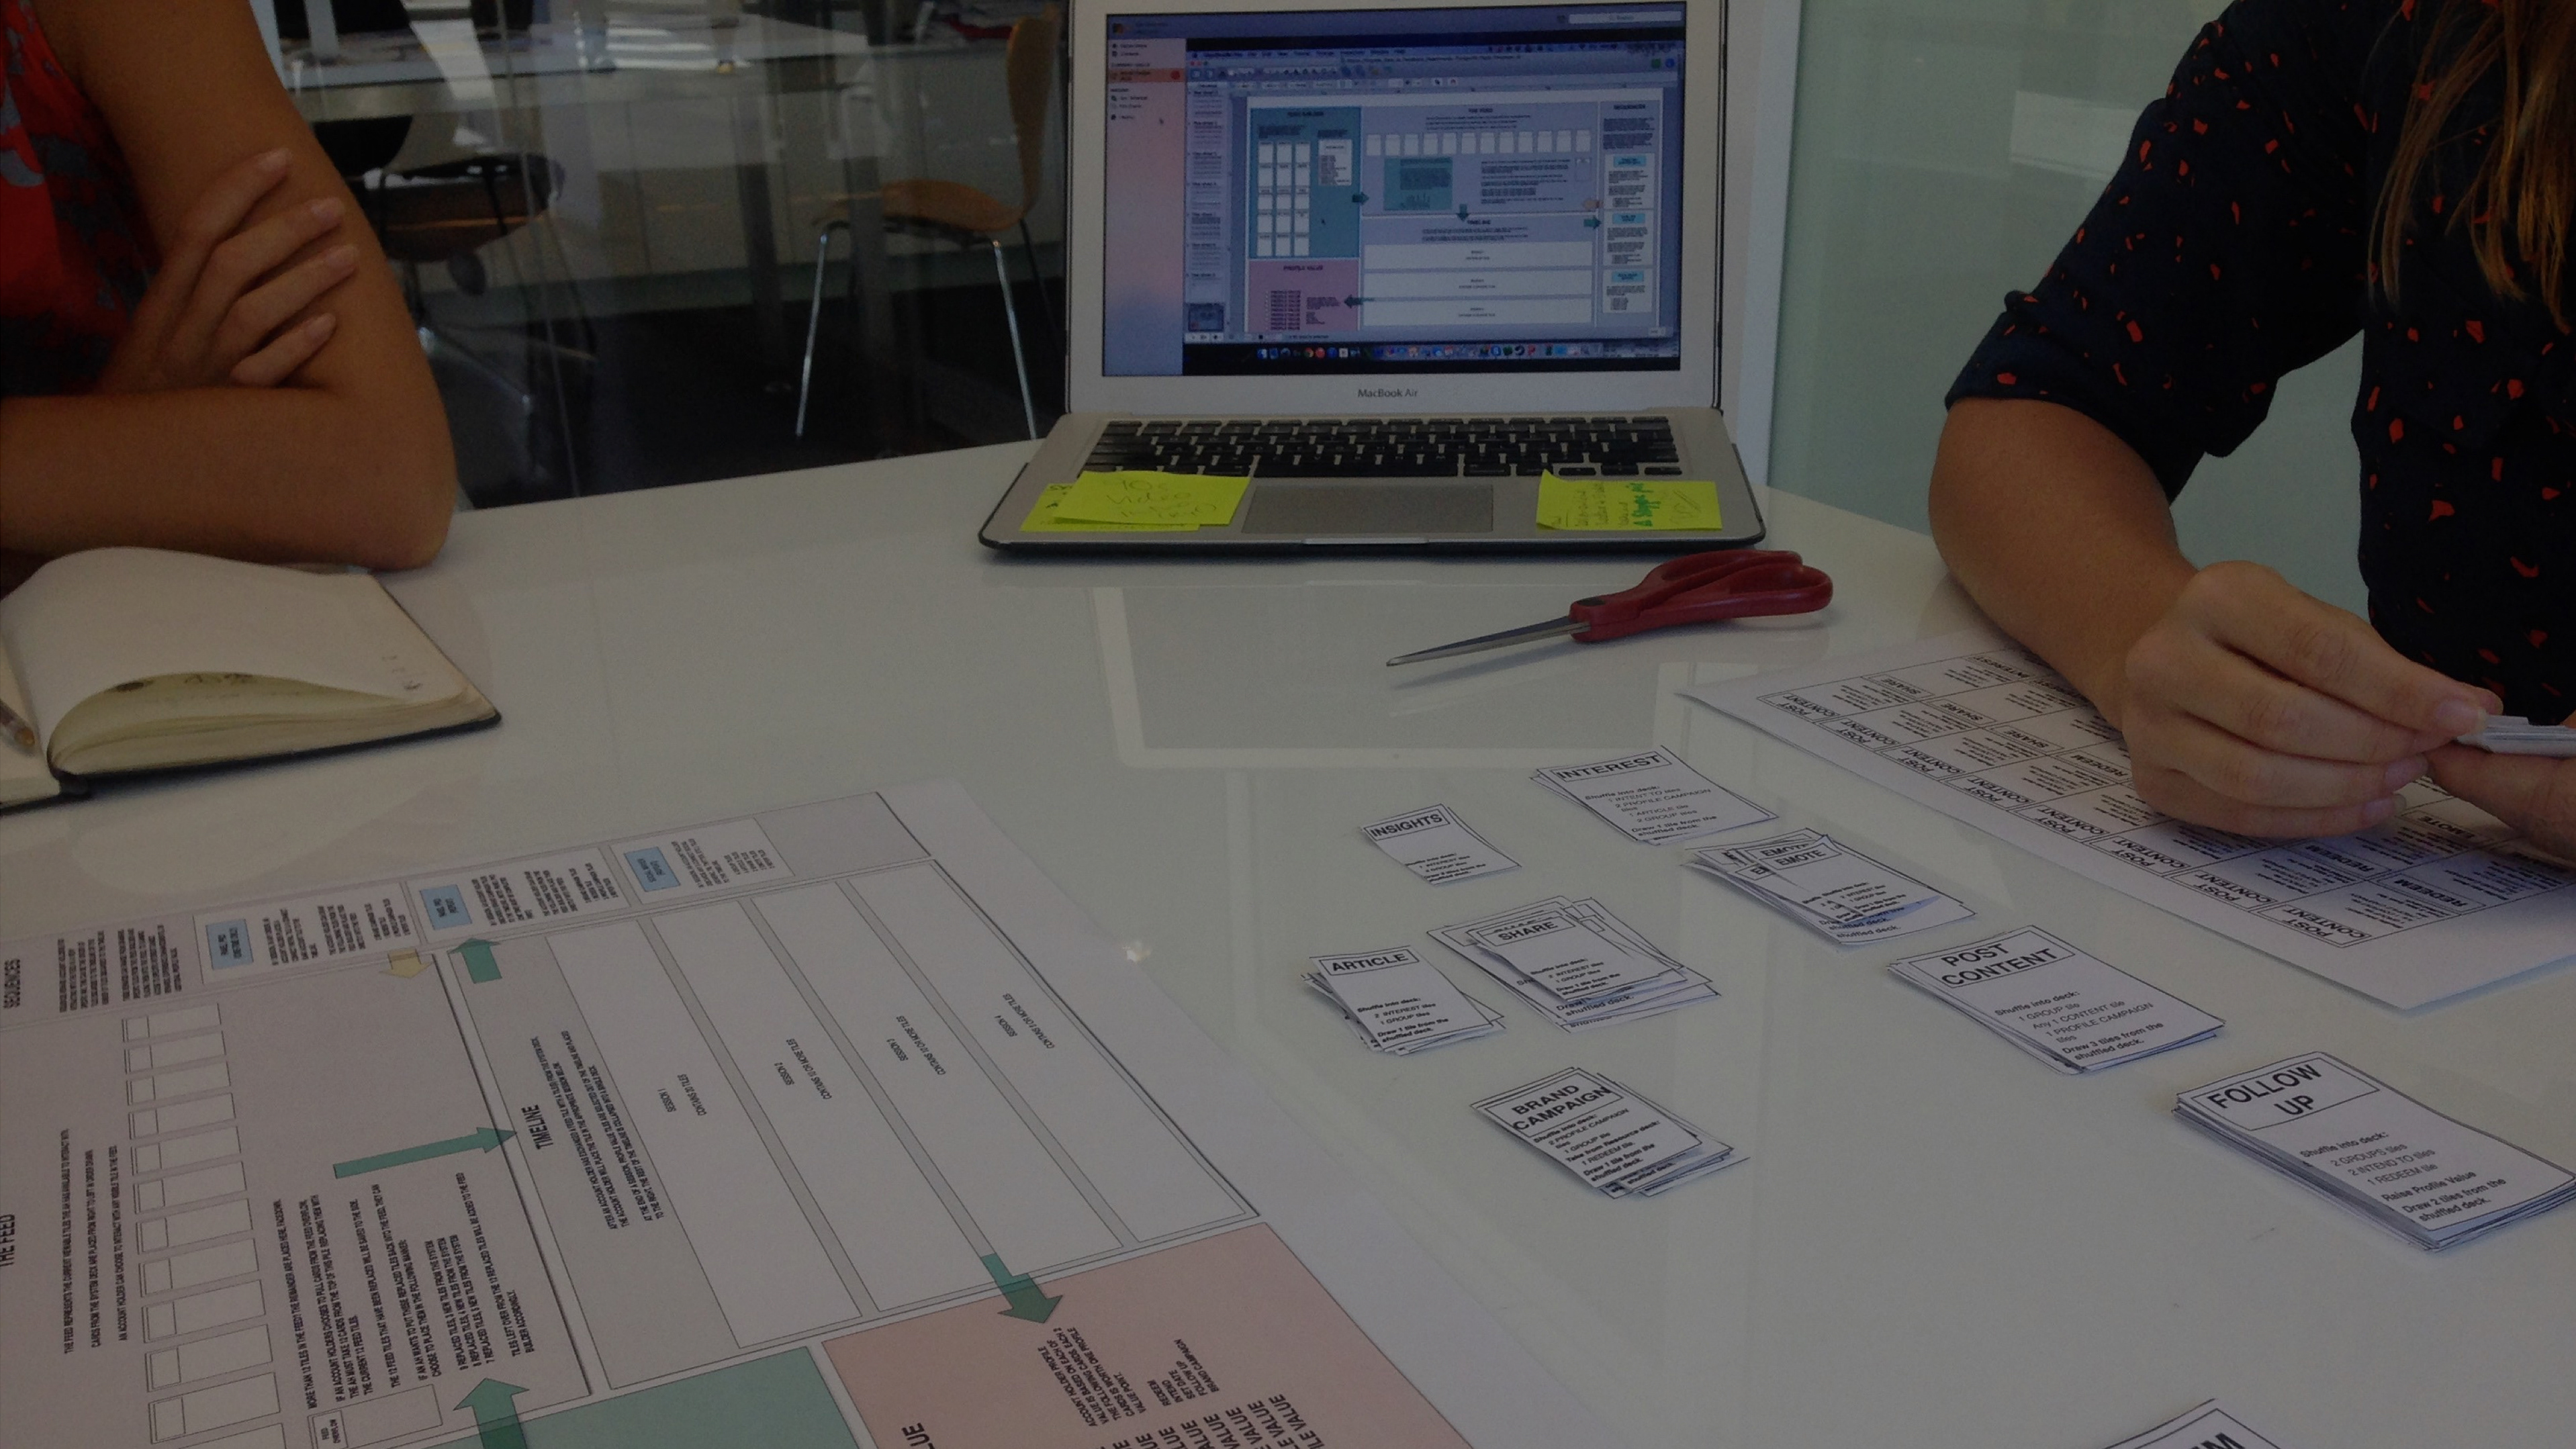
STAKEHOLDER ENGAGEMENT & RESEARCH
Stakeholder interviews and timing:
// Two weeks
// Sr. Technical Product Manager (Me)
// Sr. System Architects
// Node.js Developer
// React.js Developers
// ATG Developers
Interviews & technical research (front-end and middleware tech, APIs, and 3rd party solutions) were conducted in order to pull together the breadth of systems and integration points. In addition to this:
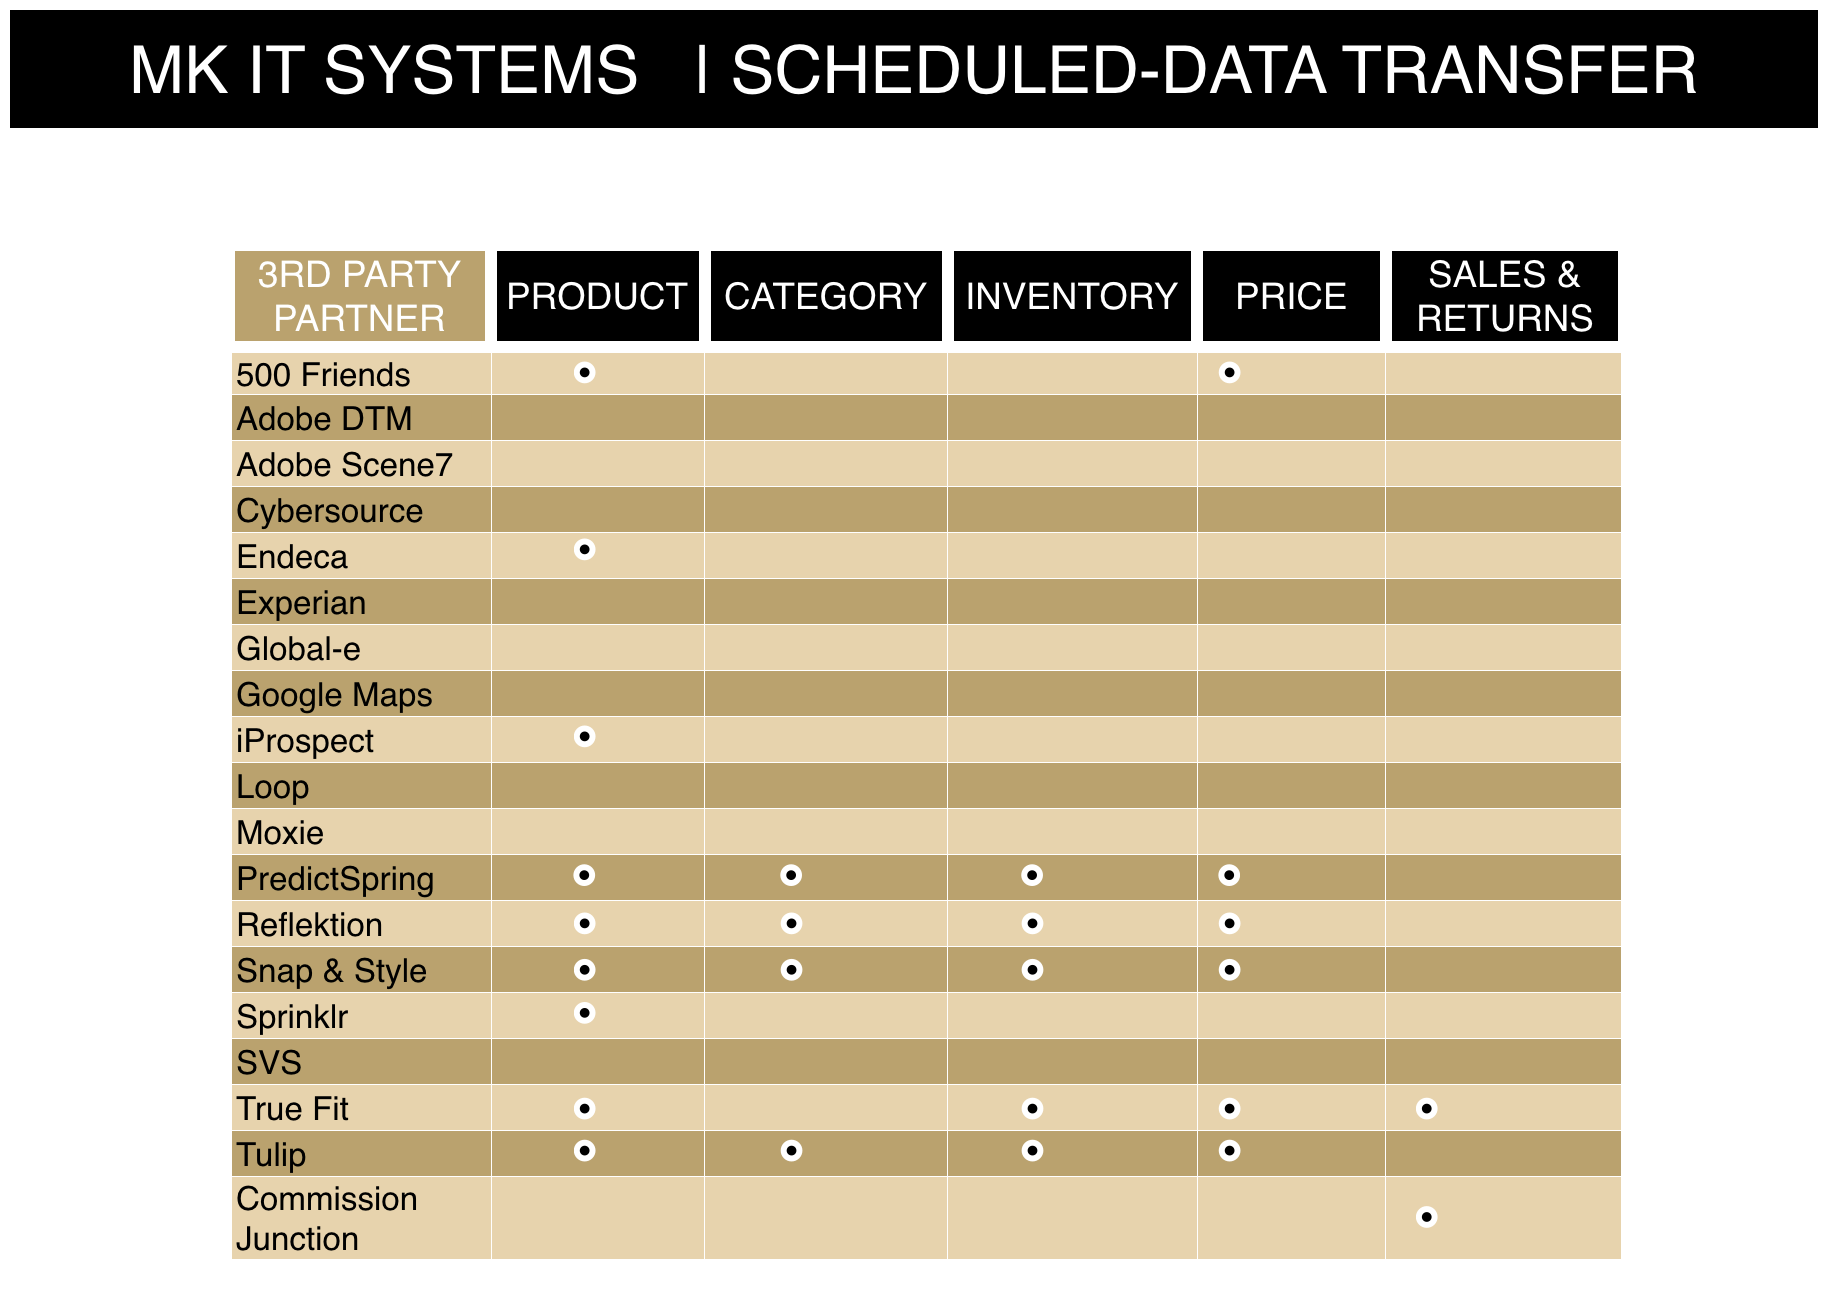
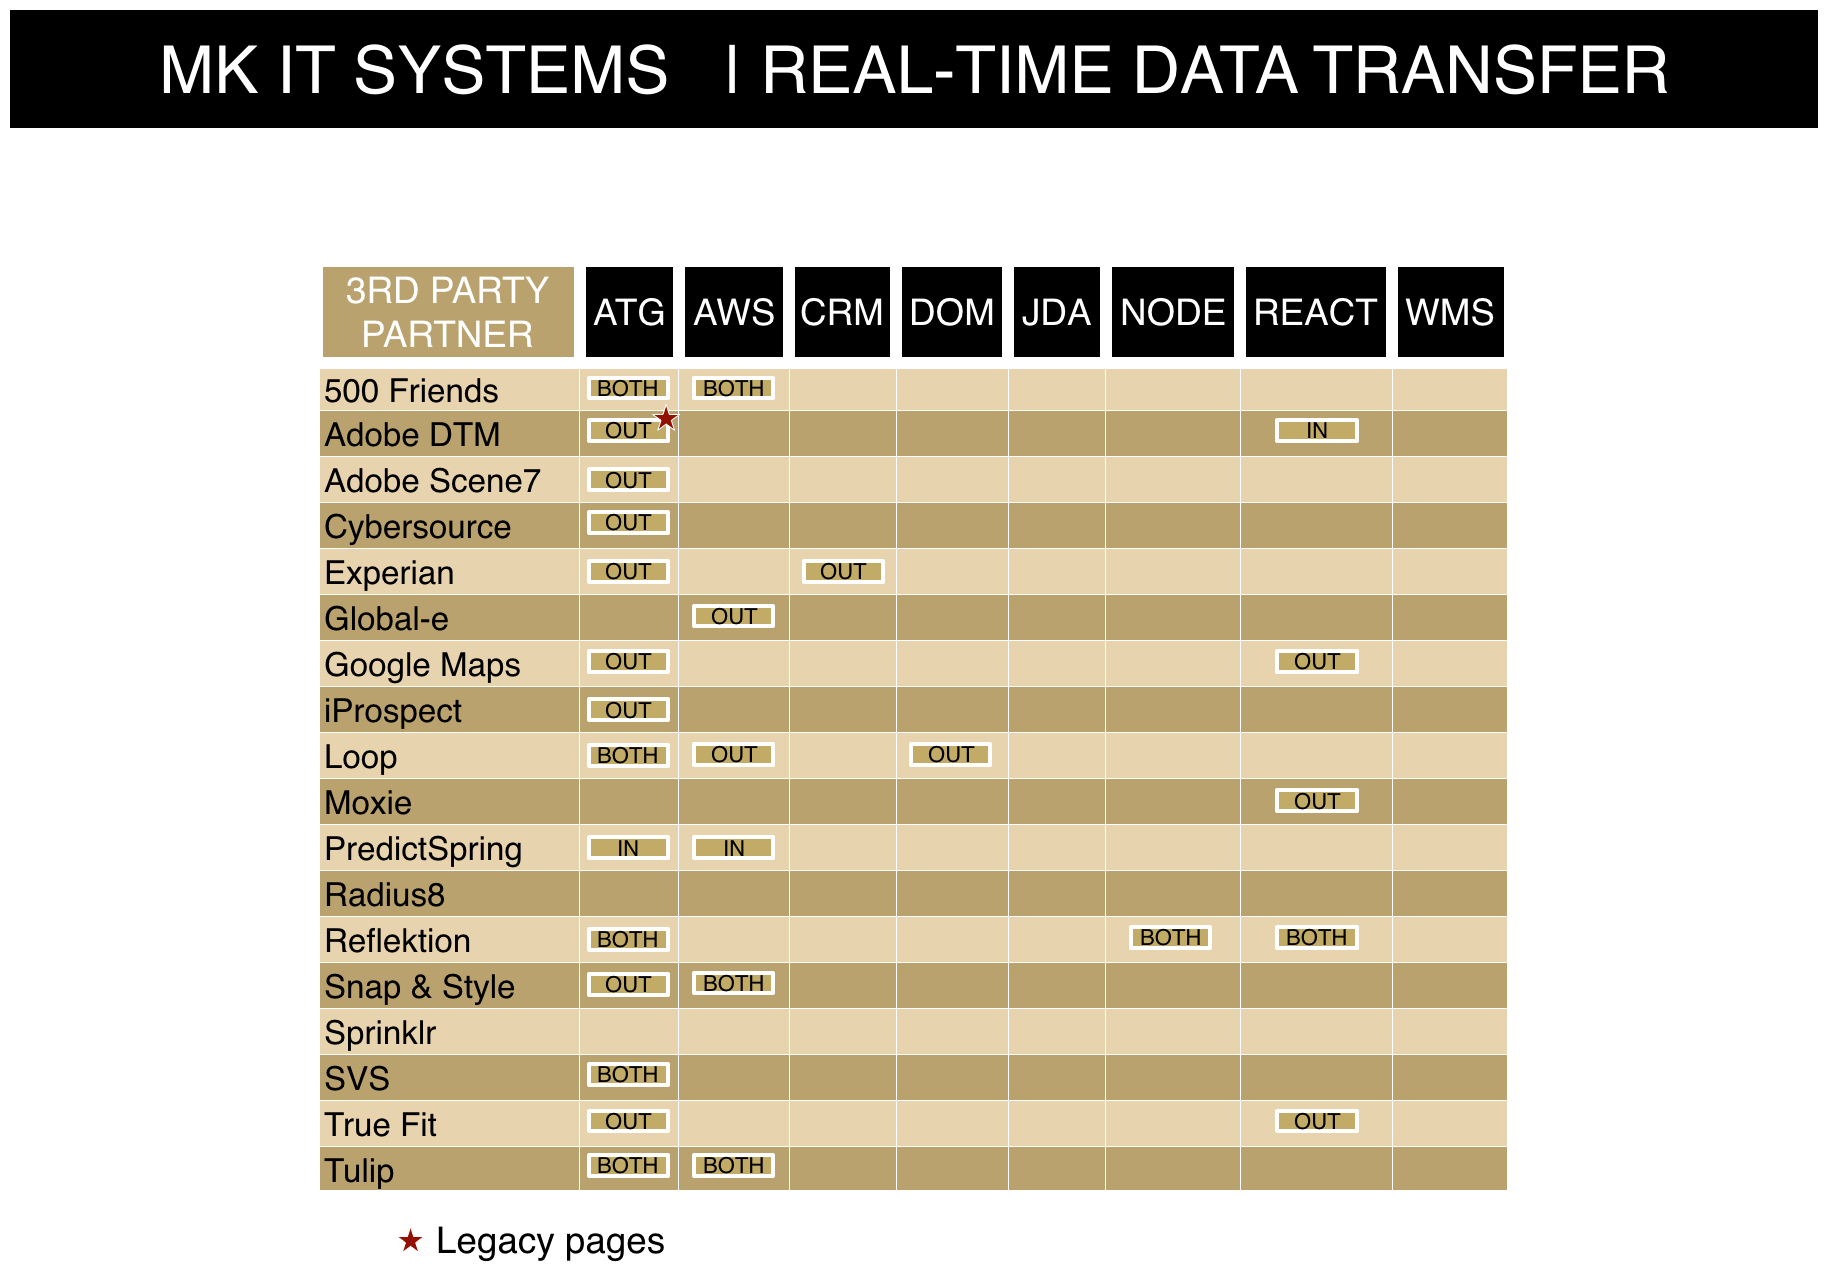
// Segregated real-time APIs and scheduled data transfers between internal and external systems
// Quantified MICHAEL KORS & 3rd party requesting systems to understand redundancies in data requests of the customer.


03/ THE RESOLVE
ON-BOARDING DOCUMENTATION & C-LEVEL COMMUNICATION
Design documentation of this fidelity improved the MICHAEL KORS visual asset library and visual ability of the product team.
// These documents drew praise and helped level set the state of technology across the interdisciplinary SCRUM team, technology team, and Executive and C-Level leadership.
// Revealed a deep company need to create documents like this
// Deeper team integration and communication through a visual standard that spoke to both tech and design.